← Back to NOISEGEN
RMS: -18.5 dBFS
PEAK: -12.2 dBFS
📥 INPUTS
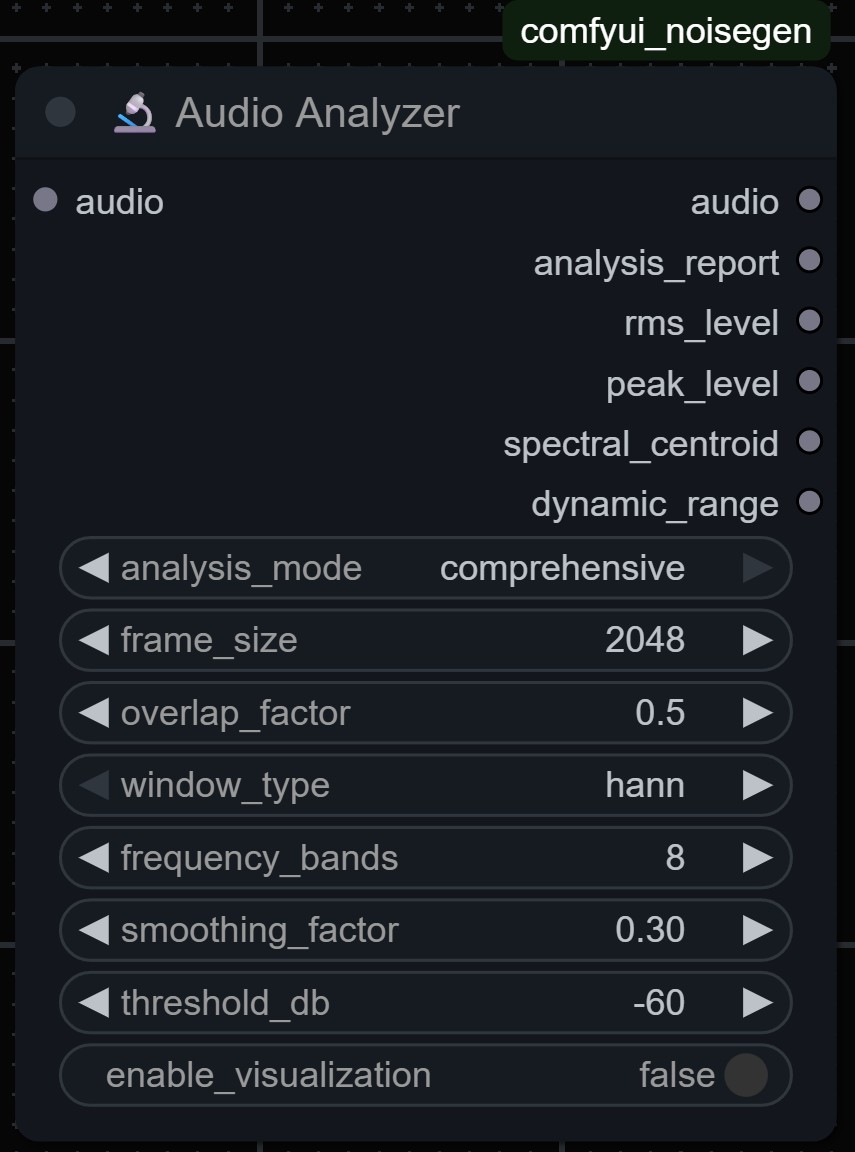
audio
AUDIO
Any ComfyUI audio format
Input audio to be analyzed. Supports mono and stereo signals at any sample rate.
analysis_mode
ENUM
Options: real_time, statistical, frequency, dynamics, quality, all
Type of analysis to perform. 'all' mode provides comprehensive measurements.
window_size
INT
Range: 256 - 8192 samples
Analysis window size. Larger windows provide better frequency resolution but slower response.
update_rate
FLOAT
Range: 1.0 - 100.0 Hz
Analysis update rate in Hz. Higher rates provide smoother real-time display.
reference_level
FLOAT
Range: -60.0 - 0.0 dBFS
Reference level for relative measurements. Default: -20.0 dBFS
frequency_bands
ENUM
Options: octave, third_octave, custom, full_spectrum
Frequency band analysis type for spectral measurements.
📤 OUTPUTS
audio
AUDIO
Passthrough - same as input
Original audio passed through unchanged for daisy-chaining with other nodes.
analysis_data
DICT
Comprehensive measurement dictionary
Complete analysis results including all measurements, available for data export or further processing.
rms_level
FLOAT
dBFS
Current RMS level in dBFS for real-time monitoring and automation.
peak_level
FLOAT
dBFS
Current peak level in dBFS for clipping detection and level management.
📊 RMS Analysis
Root Mean Square level measurement providing average signal power over time windows.
Range: -∞ to 0 dBFS
⚡ Peak Analysis
True peak detection with oversampling for accurate digital peak measurement and clipping detection.
Range: -∞ to +3 dBFS (oversampled)
📈 Crest Factor
Peak-to-RMS ratio indicating dynamic range and compression characteristics of the signal.
Range: 0 to 50 dB typical
🔬 THD+N Analysis
Total Harmonic Distortion plus Noise measurement for quality assessment and equipment testing.
Range: 0.001% to 50%
🎵 Frequency Analysis
Spectral content analysis with octave or third-octave band measurements for frequency balance assessment.
20 Hz to Nyquist frequency
⚖️ Dynamic Range
DR14 and other dynamic range measurements for loudness war analysis and mastering evaluation.
Range: 0 to 30+ DR units
🎚️ Loudness Metering
LUFS (Loudness Units Full Scale) measurement compliant with broadcasting standards.
Range: -70 to 0 LUFS
📻 Stereo Analysis
Stereo width, correlation, and phase relationship measurements for stereo field evaluation.
Correlation: -1.0 to +1.0
🔬 ANALYSIS EXAMPLES
📊 Noise Generator Quality Test
Noise Generator (white noise, 48kHz)
→ Audio Analyzer (all modes)
→ Data Export
| Parameter | Value | Purpose |
|---|
| analysis_mode | all | Complete measurement suite |
| window_size | 4096 | High frequency resolution |
| update_rate | 10.0 | Smooth real-time display |
| reference_level | -20.0 | Standard reference |
| frequency_bands | third_octave | Detailed frequency analysis |
🎸 Distortion Quality Assessment
Audio Input
→ Multi Distortion
→ Audio Analyzer (quality mode)
→ Report Generation
| Parameter | Value | Purpose |
|---|
| analysis_mode | quality | THD+N and distortion focus |
| window_size | 2048 | Balance resolution/speed |
| update_rate | 25.0 | Fast response |
| reference_level | -12.0 | Higher reference for distortion |
🔊 Speaker Response Measurement
Band Limited Noise
→ Audio Output
→ Microphone Input
→ Audio Analyzer (frequency mode)
| Parameter | Value | Purpose |
|---|
| analysis_mode | frequency | Frequency response focus |
| window_size | 8192 | Maximum frequency detail |
| frequency_bands | third_octave | Professional standard |
| update_rate | 5.0 | Stable measurements |
🎚️ Mix Loudness Compliance
Mixed Audio
→ Audio Analyzer (dynamics mode)
→ Loudness Report
| Parameter | Value | Purpose |
|---|
| analysis_mode | dynamics | Loudness and DR focus |
| window_size | 1024 | Fast dynamics response |
| update_rate | 30.0 | Broadcast standard |
| reference_level | -23.0 | LUFS broadcast reference |
📊 Analysis Mastery Tips
Use larger window sizes (4096-8192) for frequency analysis, smaller (256-1024) for dynamics tracking
RMS levels below -60 dBFS may be unreliable due to noise floor limitations
True peak readings above 0 dBFS indicate potential inter-sample peaks and clipping
Crest factor above 20 dB typically indicates very dynamic content or sparse signals
THD+N below 0.1% is considered high quality for digital audio processing
Dynamic range (DR) above 14 is considered good, above 20 is excellent for modern music
Stereo correlation below 0.5 indicates wide stereo imaging, above 0.9 indicates narrow/mono content
Use third-octave analysis for detailed frequency response, octave for general spectral balance
Higher update rates provide smoother displays but consume more CPU resources
Reference level should match your target output level for meaningful relative measurements
Enable 'all' mode for comprehensive analysis, specific modes for focused measurements
Export analysis data for detailed offline analysis and comparison between different processes
🔬 Ready to Analyze?
Audio Analyzer provides professional-grade measurements for scientific audio analysis and quality control.
← Explore More Utilities