← BACK
SPECTRUM
UTILITY
SPECTRUM
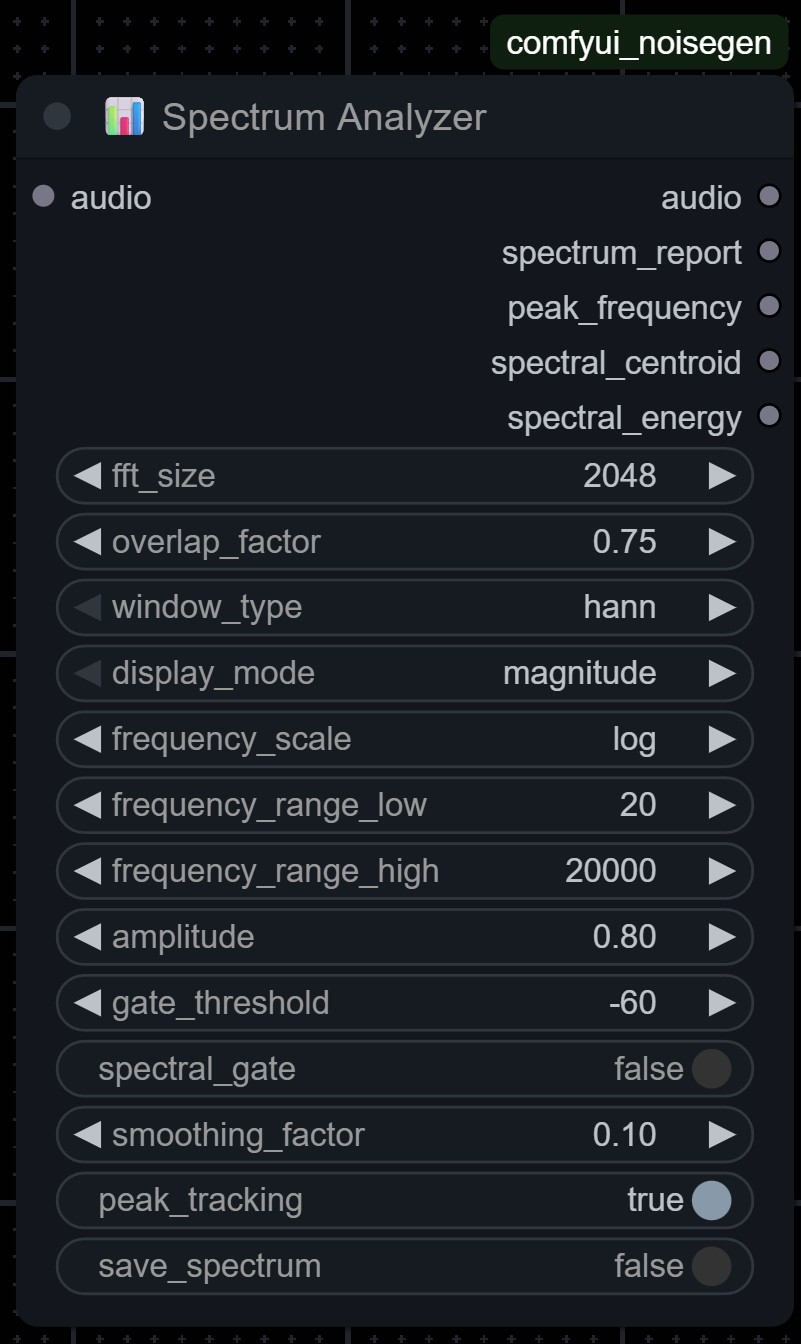
ANALYZER
Real-time frequency analysis and spectral visualization for audio monitoring and measurement applications.
Professional-grade FFT analysis with multiple display modes and measurement tools.
FREQUENCY
ANALYSIS
ANALYSIS
20Hz
200Hz
2kHz
20kHz
INPUTS
audio
AUDIO
Any ComfyUI audio format
Input audio for spectrum analysis.
fft_size
INT
512, 1024, 2048, 4096, 8192
FFT window size. Larger = better frequency resolution.
window_function
ENUM
hann, hamming, blackman, bartlett, rectangular
Window function for spectral analysis.
overlap
FLOAT
0.0 - 0.9
Window overlap ratio. Higher = smoother but more CPU.
display_mode
ENUM
magnitude, phase, power_spectrum, waterfall
Spectrum display visualization mode.
frequency_scale
ENUM
linear, logarithmic, mel, bark
Frequency axis scaling for display.
OUTPUTS
audio
AUDIO
Same format as input
Passthrough audio for daisy-chaining.
spectrum_data
ARRAY
FFT magnitude/phase data
Raw spectrum analysis data for further processing.
peak_frequency
FLOAT
Hz
Frequency with highest magnitude.
spectral_centroid
FLOAT
Hz
Spectral center of mass frequency.
FFT MAGNITUDE
Real-time frequency domain magnitude spectrum analysis.
20 HZ - 20 KHZ
PHASE SPECTRUM
Phase relationships between frequency components.
PHASE ANALYSIS
PEAK DETECTION
Automatic identification of spectral peaks and formants.
PEAK FINDING
BAND ANALYSIS
Octave and 1/3 octave band energy measurements.
BAND FILTERING
SPECTROGRAM
Time-frequency waterfall display of spectral evolution.
TIME-FREQUENCY
HARMONIC ANALYSIS
Detection and measurement of harmonic content.
HARMONICS
NOISE FLOOR
Background noise level measurement and analysis.
NOISE ANALYSIS
THD MEASUREMENT
Total harmonic distortion calculation and display.
DISTORTION
ANALYSIS EXAMPLES
NOISE SPECTRUM ANALYSIS
NOISE GENERATOR →
SPECTRUM ANALYZER →
DATA EXPORT
| PARAM | VALUE | PURPOSE |
|---|---|---|
| fft_size | 4096 | High frequency resolution |
| window_type | hann | Standard analysis window |
| averaging | exponential | Smooth spectral display |
DISTORTION MEASUREMENT
AUDIO INPUT →
MULTI DISTORTION →
SPECTRUM ANALYZER
| PARAM | VALUE | PURPOSE |
|---|---|---|
| fft_size | 8192 | Maximum resolution |
| frequency_range | full | Complete spectrum view |
| averaging | linear | Accurate measurement |
FILTER RESPONSE ANALYSIS
WHITE NOISE →
HARSH FILTER →
SPECTRUM ANALYZER
| PARAM | VALUE | PURPOSE |
|---|---|---|
| fft_size | 2048 | Good time/frequency balance |
| overlap | 0.75 | Smooth analysis |
| window_type | blackman | Low spectral leakage |
ANALYSIS TECHNIQUES
Higher FFT sizes provide better frequency resolution but slower analysis
Use Hann window for general analysis, Blackman for precise measurements
Overlap of 0.5-0.75 provides smoother spectral updates
Exponential averaging smooths fluctuations for stable display
Peak detection identifies dominant frequency components automatically
Use full frequency range for broadband analysis
Band analysis perfect for octave-based acoustic measurements
Phase analysis reveals timing relationships between components
Spectrogram shows how spectrum changes over time
THD measurement quantifies distortion in processed audio